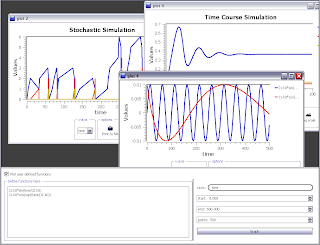
The plot window can show multiple plots, as shown above.
The plot window provides an input box for users to write any set of functions and plot those functions. This feature should be useful when designing rate expressions or other functions in the model, i.e. the user can copy the rate expressions here and plot them to see what they look like.
The options on the right-hand side of the input box allow users to specify the variable on the x-axis and other details of the equations they want to plot.
No comments:
Post a Comment