
Wednesday, May 30, 2012
Thursday, December 8, 2011
Running TinkerCell from USB
To store all the settings in a USB drive, do this:
- Use Settings -> "Export current settings" to export "settings.ini"
- Copy the "settings.ini" file to the same location as TinkerCell (on the Mac, this will be TinkerCell.app/Contents/MacOS)
- Now the TinkerCell application folder is self-contained. Copy it on a USB drive. That's all.
The "settings.ini" stores settings such as window position and sizes, catalog items to display, plot line colors, and so on. Usually, these settings are stored on the computer where TinkerCell runs, but the export option described above can be used to save and load the settings from a file. TinkerCell will first check if there is a "settings.ini" file; if not, then it will load settings from the local machine. So, if you distribute TinkerCell on a USB with the "settings.ini" file, then everyone who copied TinkerCell from that USB drive will have the same settings.
Careful when using dual-monitor: The settings file also includes window positions, so if you use a dual-monitor setup, be sure that the TinkerCell window is on the first monitor. Otherwise, it will load outside the screen when you load it in another computer without a second monitor.

Friday, November 25, 2011
Simple animation based on simulated result
The tc_setAlpha function allows C, Python, Octave plugins to change the transparency of items on the screen. This "Shade after Simulation" python plugin uses this function to perform a simple animation based on simulated data (or any other data that has been plotted). See the end of the plugins documentation for the code.


Thursday, November 10, 2011
Tuesday, September 13, 2011
SBML and Antimony as modules
The modular framework in TinkerCell is designed to support practically any format that can be loaded into TinkerCell. As a consequence, Antimony and SBML files can be used as modules. In the schreenshot below, a TinkerCell oscillator module is modeled using an Antimony script. The modular framework maps variables in the Antimony script to variables in the conceptual model.


Friday, September 2, 2011
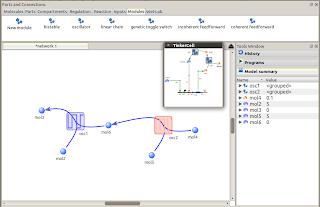
Same network, different behaviors

Coupled oscillator modules
TinkerCell's modular framework allows users to perform experiments such as the one shown below. Here, two oscillators are connected to each other. Each oscillator *can* take multiple models. This is the benefit of using modular design -- the internal details can be swapped without affecting the conceptual overall design, i.e. two coupled oscillators. One of the TinkerCell Python plugins allows users to test all possible oscillator combinations. Currently, only two oscillator designs are available (you can add more and submit to the repository if you want!). So, the total number of combinations are 4, which are the 4 graphs shown below. Notice that in one of the designs (top left), one oscillator somewhat controls the frequency of the other. By tuning parameters further, this design can actually be used to create an oscillator where the frequency is also oscillating.

Thursday, July 21, 2011
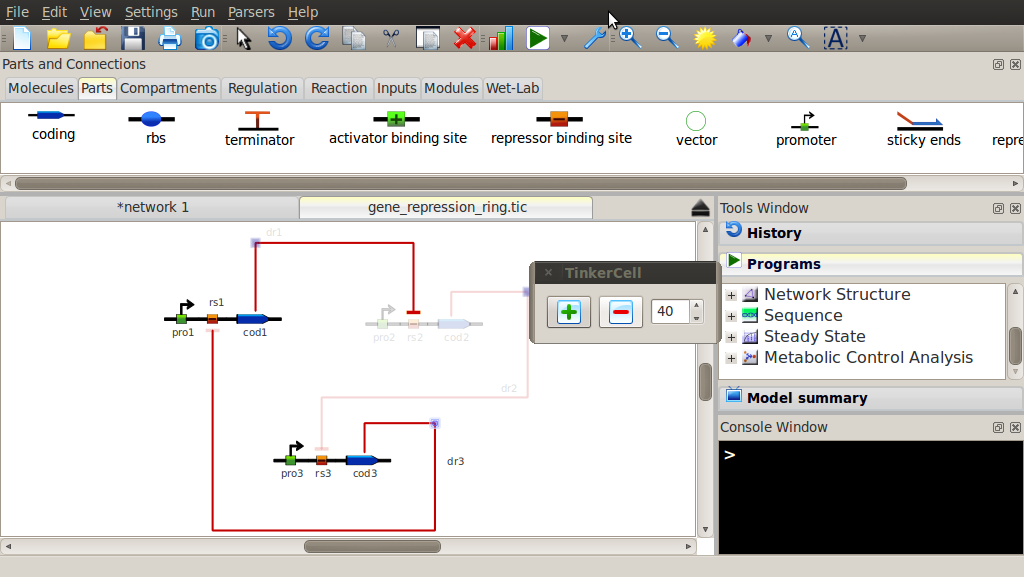
More visual cues for showing contents of equations
When hovering over components with a function, TinkerCell used to show a function tool-tip indicating how the function is defined for that component. Now, TinkerCell also highlights all the other components that are involved in that function. For example, if the activity of a gene is describes as plasmid.copy * operator1 * operator2, then TinkerCell will circle the plasmid and both operators when the mouse hovers over the gene component. See screenshots below.


Thursday, July 7, 2011
Sequence annotation widget
It was always possible to add any type of annotation to any component, including sequence annotations, in TinkerCell, but this had to be done programmatically, i.e a couple of lines of python or octave code. For sequence annotation, now the sequence-viewer plug-in also provides a simple widget for adding position and description to the selected part. The table will be saved as "sequence annotation", i.e it can be accessed via a python or octave program using:
p = tc_find("cod2"); #get the part
sa = tc_getTextDataTable(x, "sequence annotation"); #get sequence annotation
tc_getTableValue( sa, 0, 0)

Thursday, June 30, 2011
Automatically test Design Variations
By using the tc_substituteEmptyModel and tc_substituteOriginalModel, it is possible to systematically remove each regulation from a design and check the results. The python plugin that does just that produces the following result. The code is given below.

In the example below the input-output relationship is tested as different regulations in a feed-forward network are pruned.

"""category: Model Variationsname: Try Different Designs Automaticallydescr: Try removing each individual regulation one at a time and see how that affects the modelmenu: yesicon: module.pngtool: no"""from tinkercell import *
def runAll(indep, start, end, nclusters=0):items = tc_allItems()listOfModules = []moduleNames = []for i in range(0, items.length):item = tc_getItem(items, i)if tc_getParent(item) == 0:submodels = tc_listOfPossibleModels(item)if submodels.length > 0:listOfModules.append(item)moduleNames.append(tc_getUniqueName(item))n = len(listOfModules)if n > 0:tc_multiplot(2, int(1+n/2))tc_showProgress("Explore design variations", 0)for i in range(0,n):tc_substituteEmptyModel(listOfModules[i])if indep.lower() == "time":m = tc_simulateDeterministic(start,end,100)tc_plot(m, moduleNames[i] + " removed")else:m = tc_steadyStateScan(indep, start,end,10)tc_plot(m, moduleNames[i] + " removed")tc_substituteOriginalModel(listOfModules[i])tc_showProgress("Explore design variations", int(100*(i+1)/n))
tc_showProgress("Explore design variations", 100)if nclusters > 1:m = tc_clusterPlots(nclusters)fout = open("designs.txt","w")for i in range(0, nclusters):s = "========\nCluster " + str(i+1) + "\n========\n"for j in range(0, n):if tc_getMatrixValue(m, j, 0) == i+1:s += " , " + moduleNames[j]s += "\n"s += "\n"fout.write(s)fout.close()tc_openUrl("designs.txt")else:if indep.lower() == "time":m = tc_simulateDeterministic(start,end,100)tc_plot(m, "steady state scan")else:m = tc_steadyStateScan(indep, start,end,10)tc_plot(m, "simulation")return
params = tc_getParametersAndFixedVariables(tc_allItems())list = fromTC(params.rownames)list.insert(0,"Time")inputWindow = tc_createMatrix(3, 1)tc_setMatrixValue(inputWindow, 0, 0, 0)tc_setMatrixValue(inputWindow, 1, 0, 0.0)tc_setMatrixValue(inputWindow, 2, 0, 200.0)tc_setMatrixValue(inputWindow, 3, 0, 4)tc_setRowName(inputWindow, 0, "Independent variable")tc_setRowName(inputWindow, 1, "Start")tc_setRowName(inputWindow, 2, "Stop")tc_setRowName(inputWindow, 3, "Clusters")tc_createInputWindowForScript(inputWindow, "Explore design variations", "runAll")tc_addInputWindowOptions("Explore design variations", 0, 0, toTC(list))
Friday, June 24, 2011
Optimize any Python Function using Particle Swarm
The code given below was used to generate parameter set for making a non-monotonic input-output steady state plot. The code uses Particle Swarm optimization algorithm. It allows multiple runs of the algorithm for finding multiple minima.

from tinkercell import *
from tc2py import *
from numpy import *
from PSO import * #particle swarm optimization (included with TinkerCell)
nameOfInput ="INPUT" #name of input variable in the model
nameOfOutput ="OUTPUT" #name of output variable in the model
params = tc_createMatrix(1,1)
tc_setRowName(params,0,nameOfInput)
def Objective():
tc_setMatrixValue(params, 0, 0, 0.1)
tc_updateParameters(params)
ss = tc_getSteadyState()
i = tc_getRowIndex(ss, nameOfOutput)
x1 = tc_getMatrixValue(ss, i, 0)
tc_setMatrixValue(params, 0, 0, 2)
tc_updateParameters(params)
ss = tc_getSteadyState()
x2 = tc_getMatrixValue(ss, i, 0)
tc_setMatrixValue(params, 0, 0, 5)
tc_updateParameters(params)
ss = tc_getSteadyState()
x3 = tc_getMatrixValue(ss, i, 0)
if x3 > x1: x1 = x3
return (x2 - x1)
optimizer = ParticleSwarm()
#minimize or maximize?
optimizer.numpoints = 50
optimizer.maxiter = 10
optimizer.minimize = False
optimizer.title = "Nonmonotic test"
g = optimizer.run(Objective,10) #multiple runs
Saturday, June 18, 2011
Automatically test Model Variations
The TryModelVariants.py is a new python plugin that tries all the different models for the same "diagram". For example, in the diagram below two enzymes catalyze the conversion to themselves, i.e. both are autocatalytic. One might suspect that such a system will become bistable, somewhat like the genetic toggle-swtich. However, this system is only bistable when modeled using steady state assumptions (i.e. Michaelis-Menten) and monostable when modeled using simple mass-action reactions. This python plugin can be used to varify such model-dependent behavior. This shows how models should be double-checked before trying to use them to make conclusions about the real system.

Improved Clustering Function
The tc_clusterPlots function now returns the results of the clustering. Earlier, it was just plotting the clusters. Now, plugins can use the returned values to identify which plot each of the inputs belong in. For example, the TryModelVariants.py plugin uses this information to identify sub-models (e.g. whether or not to include mRNA, how to model transcription regulation) that are responsible for creating different behaviors. The plugin outputs the cluster plots and outputs the sub-models in each cluster in a file.
Cluster plots

and the sub-models for each cluster

 ...the file contains all the clusters, but those are not shown here.
Cluster plots

and the sub-models for each cluster


Thursday, June 16, 2011
Composite Parts
Composite parts were present in TinkerCell for some time, but they did not behave nicely. Now they do. Composite parts are basically containers with other parts. They can be snapped together.


Tuesday, June 7, 2011
An architecture for incorporating experiments

The above diagram represents a general data-representation TinkerCell is assuming. TinkerCell represents the "biology" (not the mathematical model). There are methods such as numerical analysis or wet-lab experiments that take the biology and generate data. The middle area (i.e. experiments and simulations) should connect the biology to the data -- probably the main challenge.
Monday, June 6, 2011
Load GenBank & Data from BioFAB.org


The above screenshots are from a python plugin that gets BioFAB (biofab.org) parts and automatically places the parts on the screen. It also plots the experimental data available at BioFAB.
The next step is to automatically generate the model and perform basic parameter estimation.
"Dim" certain regions of the model
The "sun" icon next to the zoom icons in the top toolbar allows users to adjust the transparency of selected regions on the screen.
Wednesday, May 25, 2011
Steps toward wet-lab integration
Some plans ahead include integrating wet-lab data. The diagram will be generated using semantics in order to make the integration more structured. Currently, users can draw "experiment" connections and "data" nodes. The RDF files in the TinkerCell home folder /Lab store the ontology for each. The idea is that python plugins will be used to fill in details about the experiment and the data. The long term goal is to make diagrams like these part of exchange and maybe lab automation. TinkerCell's ability to explicitly identify cells, plasmids, fluorescent proteins, and other relevant components can serve as the link between predicted results from models and experimental results.


Simple perturbation python plug-in

The plugin removes each promoter one by one and performs a simulation to see the consequence of the removal. The plugin also allows the user to perturb RBS strength and mRNA degradation by a given amount. The entire plugin is written in python and the source is available in the TinkerCell home folder.
Subscribe to:
Posts (Atom)